Exercise week 8
Task 1 (Problem 6.5 in G&W)
In a simple RGB image, the , , and component images have the horizontal intensity profiles shown in the following diagram. What color would a person see in the middle position () of this image?

Task 2 (Problem 6.6 in G&W)
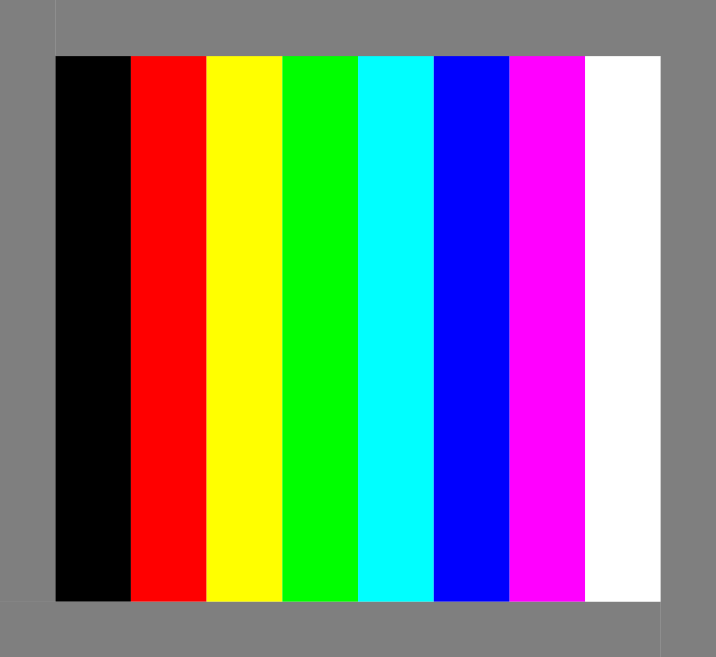
Sketch the RGB components of the following image as they would appear on a monochrome monitor. All colors are at maximum intensity and saturation. In working this problem, consider the gray border as part of the image.

Task 3 (Problem 6.7 in G&W)
How many different shades of gray are there in a color RGB system in which each RGB image is an 8-bit image?
Task 4
In this task, you should implement some image processing. You should use existing library routines for image io, but implement the image conversion and histogram yourself. Although, feel free to test your implementatio by comparing your results to that of built-in functions.
a)
Implement a program that reads an RGB image
(e.g. rose_rgb.png, found here, and converts it to a
grayscale image. That is, convert it from RGB to HSI, and use the I component as the grayscale
image.
b)
Compare the histogram of each of the R, G, and B components with the histogram of the I component. Would it be possible to predict the I histogram from the other three?
Task 5
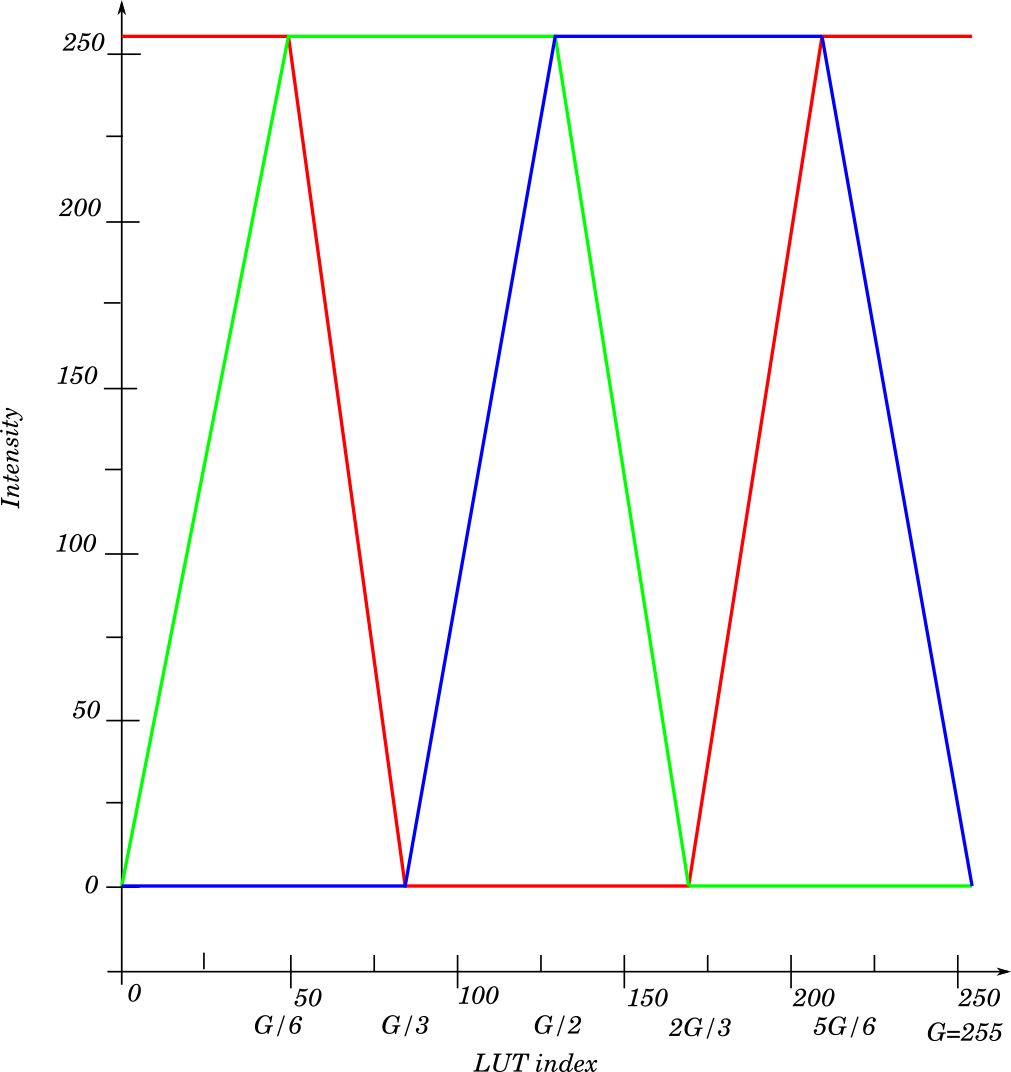
An 8-bit graylevel image (with 256 graylevels) is shown with a RGB pseudo color look up table, where the R, G, B components are as shown in the figure.

a)
What color will pixels with gray level index be shown as?
b)
What color will pixels with gray level index be shown as?
c)
Can you briefly explain how the colors will change when the the gray-level index goes from 0 to 255? That is, how will the look up table look like?
d)
If you draw an RGB cube, what parts of the RGB cube will the lut cover? Illustrate with a figure.
e)
If we convert from RGB to HSI, how will H, S, and I change when the gray level index goes from 0 to 255?