Solution proposal - exercise 6
We are asked to implement a univariate Gaussian classifier, and use it to classify 6 different images, using features obtained from these images. I will only list the results in the following, but the source for obtaining these results is available here.
The following masks where used to obtain training features, and test features, respectively.
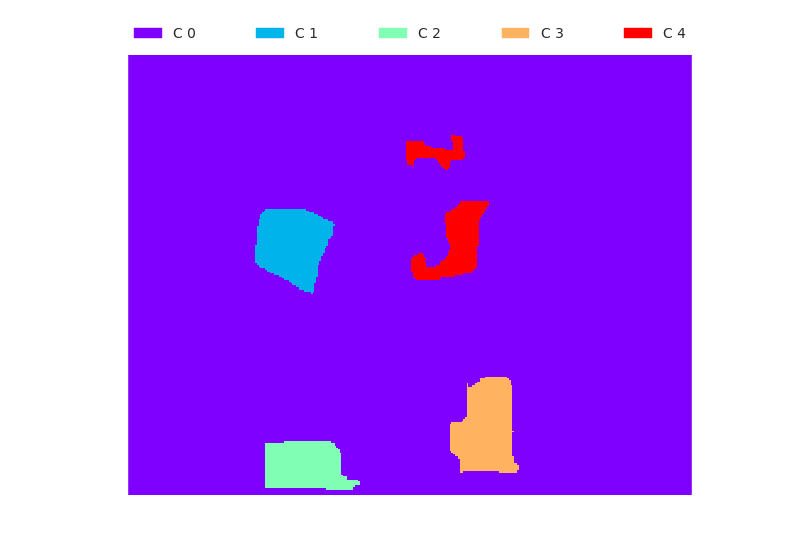
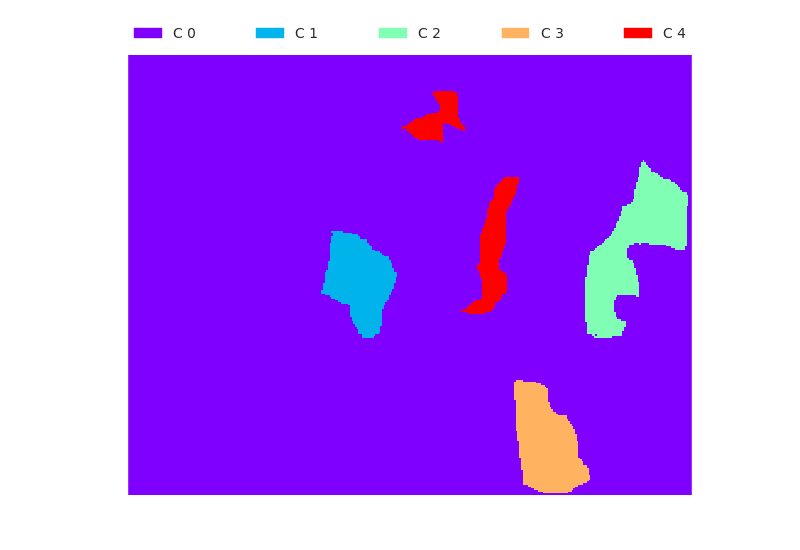
Figure 0.1 Train mask (left), and test mask (right).
Feature image 1
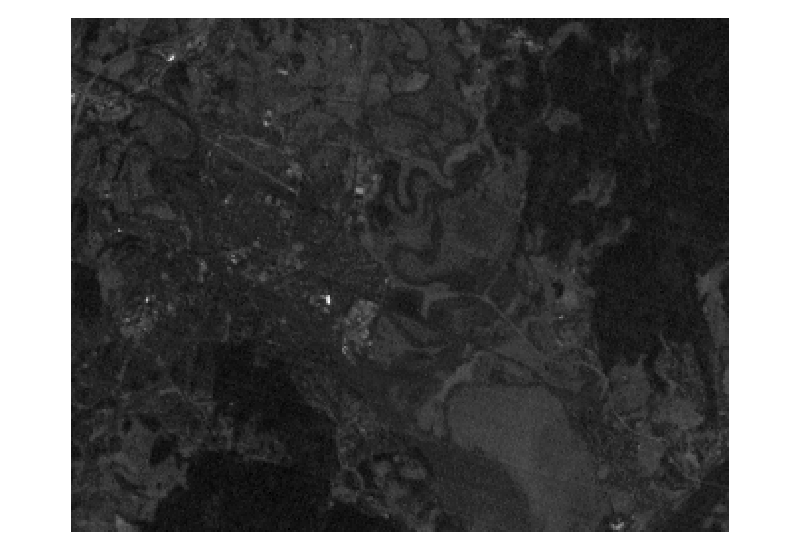
Figure 1.1 Original `tm1.png`.
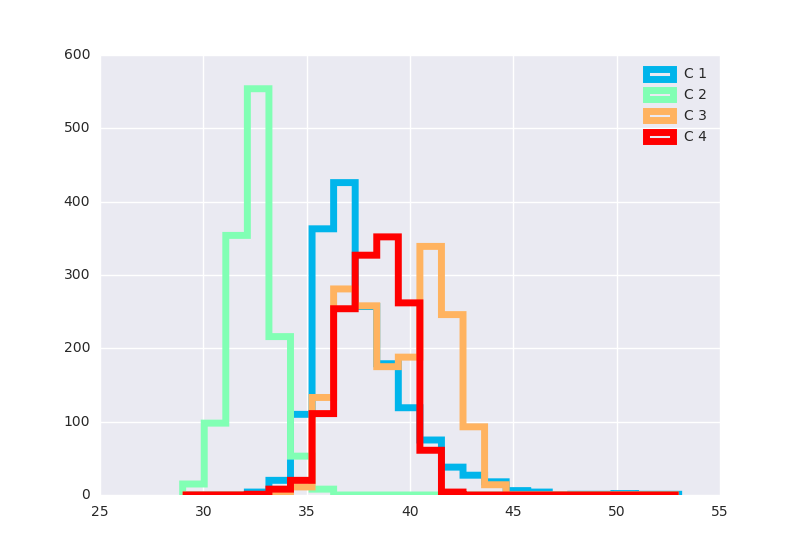
Figure 1.2 Feature value distribution from training, `tm1.png`.
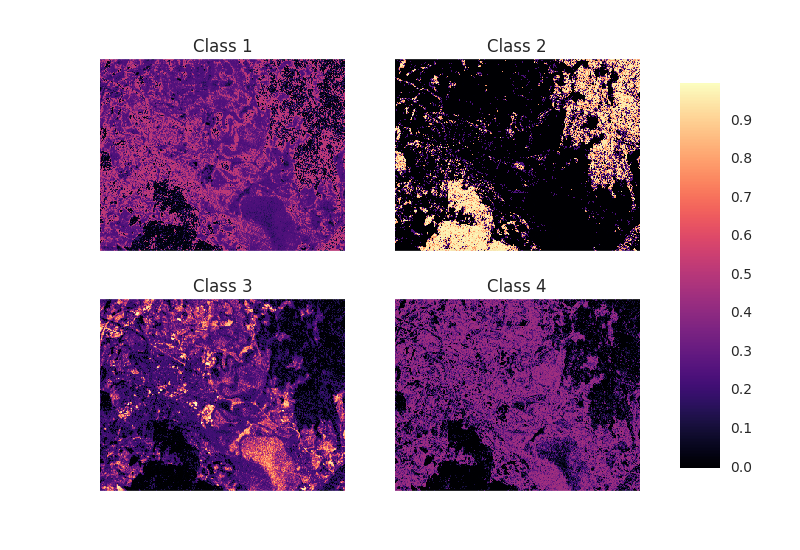
Figure 1.3 Posterior images from `tm1.png`.
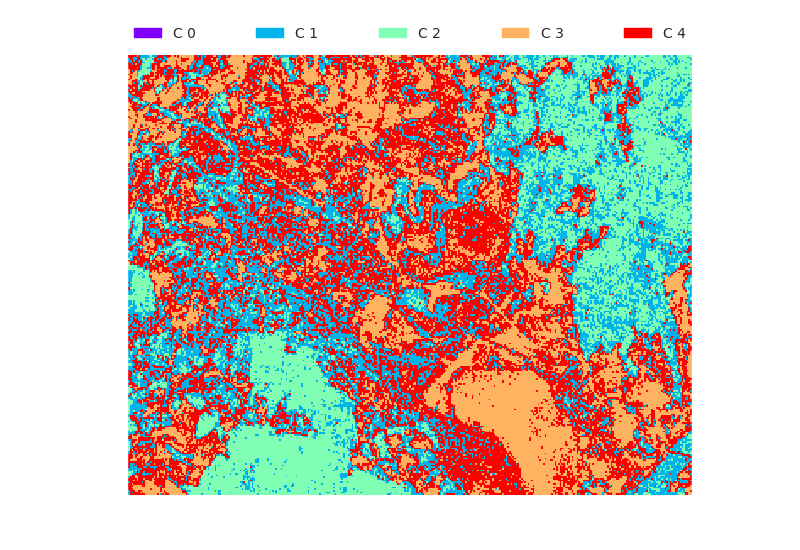
Figure 1.4 Classification result on `tm1.png`.
| Measure | Class 1 | Class 2 | Class 3 | Class 4 |
|---|---|---|---|---|
| RP | 1,729 | 2,824 | 1,979 | 1,605 |
| RN | 6,408 | 5,313 | 6,158 | 6,532 |
| PP | 1,591 | 1,827 | 2,346 | 2,373 |
| PN | 6,546 | 6,310 | 5,791 | 5,764 |
| TP | 416 | 1,816 | 1,647 | 1,118 |
| FP | 1,175 | 11 | 699 | 1,255 |
| FN | 1,313 | 1,008 | 332 | 487 |
| TN | 5,233 | 5,302 | 5,459 | 5,277 |
| tpr | 0.24 | 0.64 | 0.83 | 0.70 |
| tnr | 0.82 | 1.00 | 0.89 | 0.81 |
| ppv | 0.26 | 0.99 | 0.70 | 0.47 |
| npv | 0.80 | 0.84 | 0.94 | 0.92 |
| acc | 0.69 | 0.87 | 0.87 | 0.79 |
| iou | 0.14 | 0.64 | 0.62 | 0.39 |
| dsc | 0.25 | 0.78 | 0.76 | 0.56 |
| auc | 0.53 | 0.82 | 0.86 | 0.75 |
Feature image 2
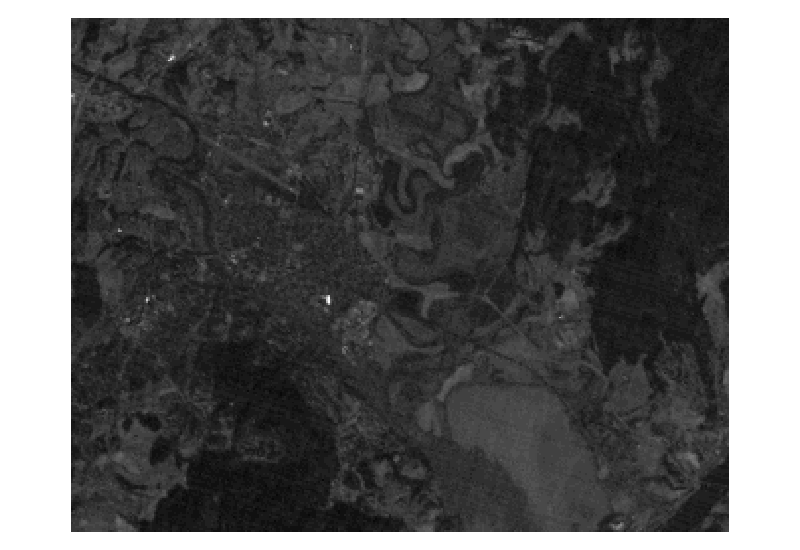
Figure 2.1 Original `tm2.png`.
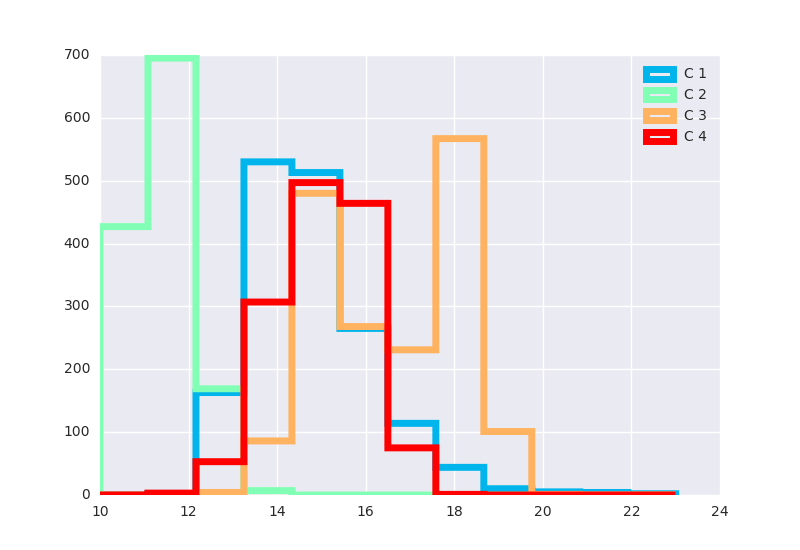
Figure 2.2 Feature value distribution from training, `tm2.png`.
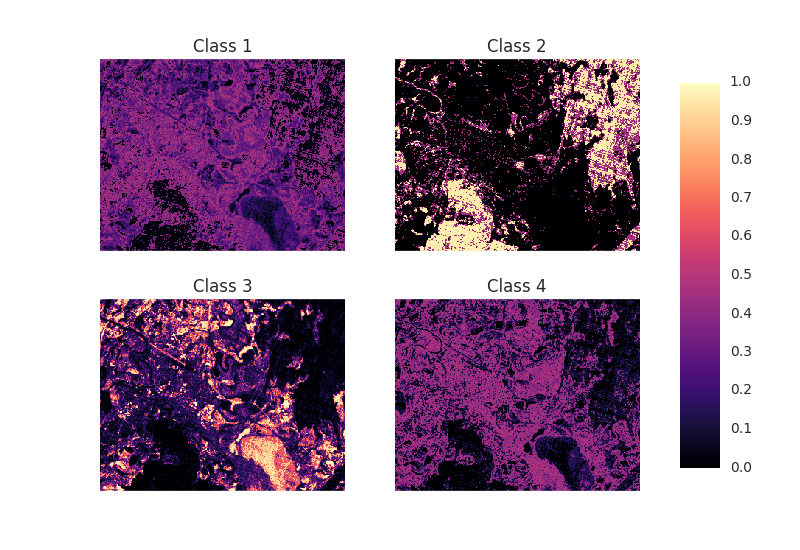
Figure 2.3 Posterior images from `tm2.png`.
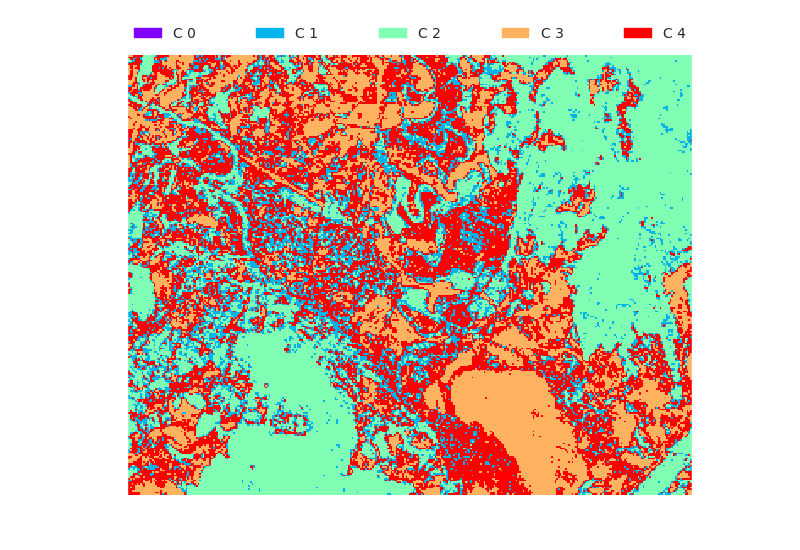
Figure 2.4 Classification result on `tm2.png`.
| Measure | Class 1 | Class 2 | Class 3 | Class 4 |
|---|---|---|---|---|
| RP | 1,729 | 2,824 | 1,979 | 1,605 |
| RN | 6,408 | 5,313 | 6,158 | 6,532 |
| PP | 926 | 3,060 | 2,187 | 1,964 |
| PN | 7,211 | 5,077 | 5,950 | 6,173 |
| TP | 452 | 2,700 | 1,813 | 972 |
| FP | 474 | 360 | 374 | 992 |
| FN | 1,277 | 124 | 166 | 633 |
| TN | 5,934 | 4,953 | 5,784 | 5,540 |
| tpr | 0.26 | 0.96 | 0.92 | 0.61 |
| tnr | 0.93 | 0.93 | 0.94 | 0.85 |
| ppv | 0.49 | 0.88 | 0.83 | 0.49 |
| npv | 0.82 | 0.98 | 0.97 | 0.90 |
| acc | 0.78 | 0.94 | 0.93 | 0.80 |
| iou | 0.21 | 0.85 | 0.77 | 0.37 |
| dsc | 0.34 | 0.92 | 0.87 | 0.54 |
| auc | 0.59 | 0.94 | 0.93 | 0.73 |
Feature image 3

Figure 3.1 Original `tm1.png`.
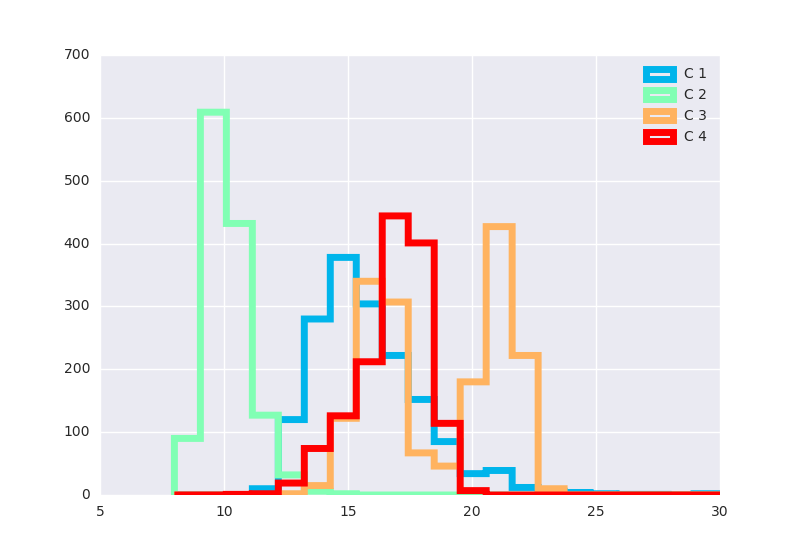
Figure 3.2 Feature value distribution from training, `tm3.png`.
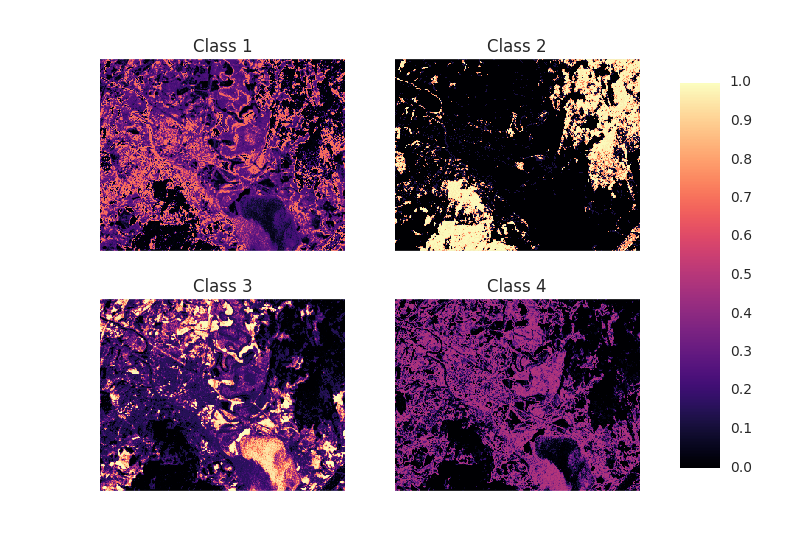
Figure 3.3 Posterior images from `tm3.png`.
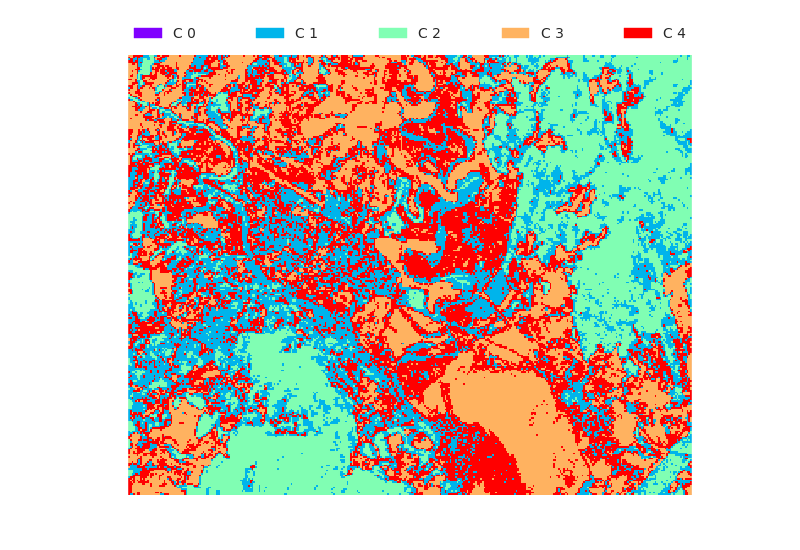
Figure 3.4 Classification result on `tm3.png`.
| Measure | Class 1 | Class 2 | Class 3 | Class 4 |
|---|---|---|---|---|
| RP | 1,729 | 2,824 | 1,979 | 1,605 |
| RN | 6,408 | 5,313 | 6,158 | 6,532 |
| PP | 1,653 | 2,297 | 2,267 | 1,920 |
| PN | 6,484 | 5,840 | 5,870 | 6,217 |
| TP | 708 | 2,286 | 1,825 | 1,033 |
| FP | 945 | 11 | 442 | 887 |
| FN | 1,021 | 538 | 154 | 572 |
| TN | 5,463 | 5,302 | 5,716 | 5,645 |
| tpr | 0.41 | 0.81 | 0.92 | 0.64 |
| tnr | 0.85 | 1.00 | 0.93 | 0.86 |
| ppv | 0.43 | 1.00 | 0.81 | 0.54 |
| npv | 0.84 | 0.91 | 0.97 | 0.91 |
| acc | 0.76 | 0.93 | 0.93 | 0.82 |
| iou | 0.26 | 0.81 | 0.75 | 0.41 |
| dsc | 0.42 | 0.89 | 0.86 | 0.59 |
| auc | 0.63 | 0.90 | 0.93 | 0.75 |
Feature image 4
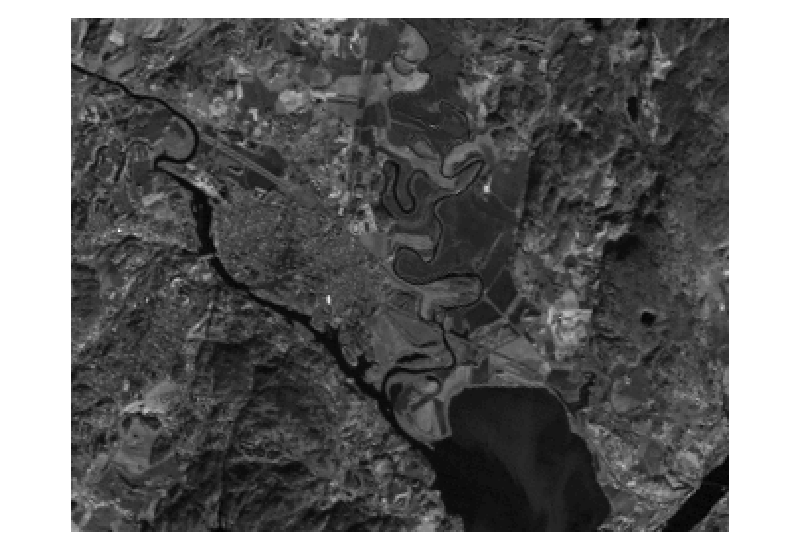
Figure 4.1 Original `tm4.png`.
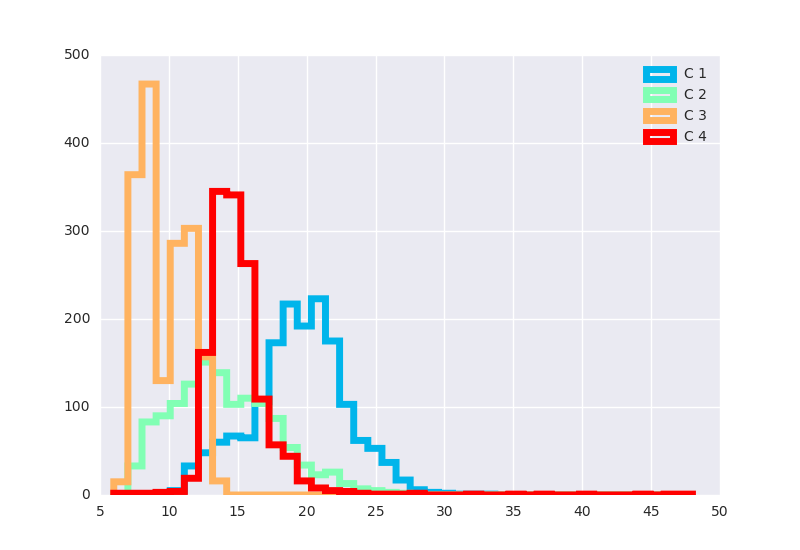
Figure 4.2 Feature value distribution from training, `tm4.png`.
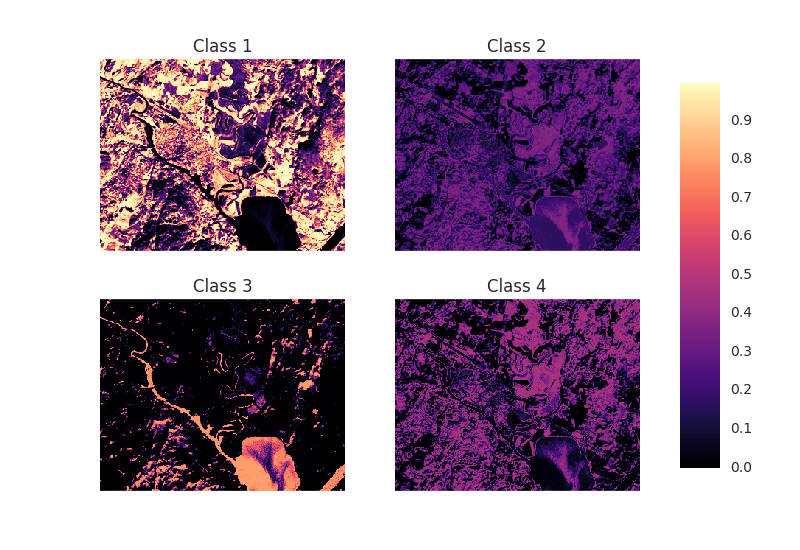
Figure 4.3 Posterior images from `tm4.png`.
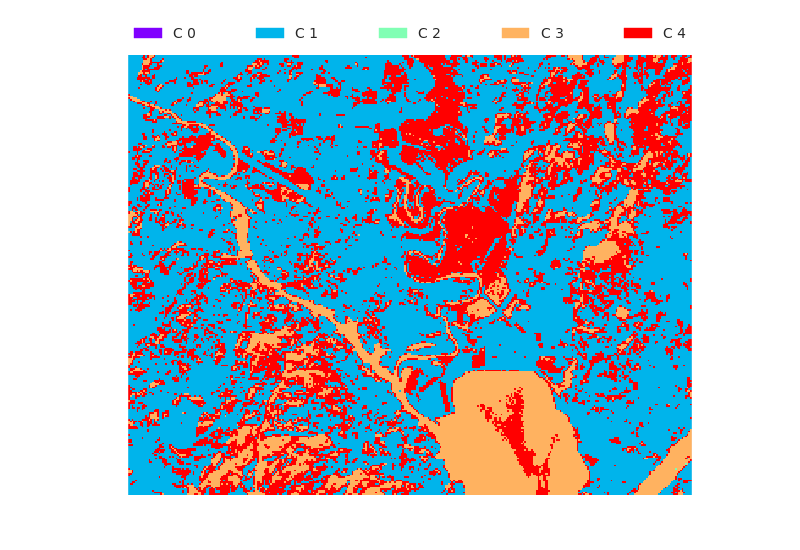
Figure 4.4 Classification result on `tm4.png`.
| Measure | Class 1 | Class 2 | Class 3 | Class 4 |
|---|---|---|---|---|
| RP | 1,729 | 2,824 | 1,979 | 1,605 |
| RN | 6,408 | 5,313 | 6,158 | 6,532 |
| PP | 2,921 | 0 | 2,132 | 3,084 |
| PN | 5,216 | 8,137 | 6,005 | 5,053 |
| TP | 1,417 | 0 | 1,594 | 1,258 |
| FP | 1,504 | 0 | 538 | 1,826 |
| FN | 312 | 2,824 | 385 | 347 |
| TN | 4,904 | 5,313 | 5,620 | 4,706 |
| tpr | 0.82 | 0.00 | 0.81 | 0.78 |
| tnr | 0.77 | 1.00 | 0.91 | 0.72 |
| ppv | 0.49 | nan | 0.75 | 0.41 |
| npv | 0.94 | 0.65 | 0.94 | 0.93 |
| acc | 0.78 | 0.65 | 0.89 | 0.73 |
| iou | 0.44 | 0.00 | 0.63 | 0.37 |
| dsc | 0.61 | 0.00 | 0.78 | 0.54 |
| auc | 0.79 | 0.50 | 0.86 | 0.75 |
Feature image 5
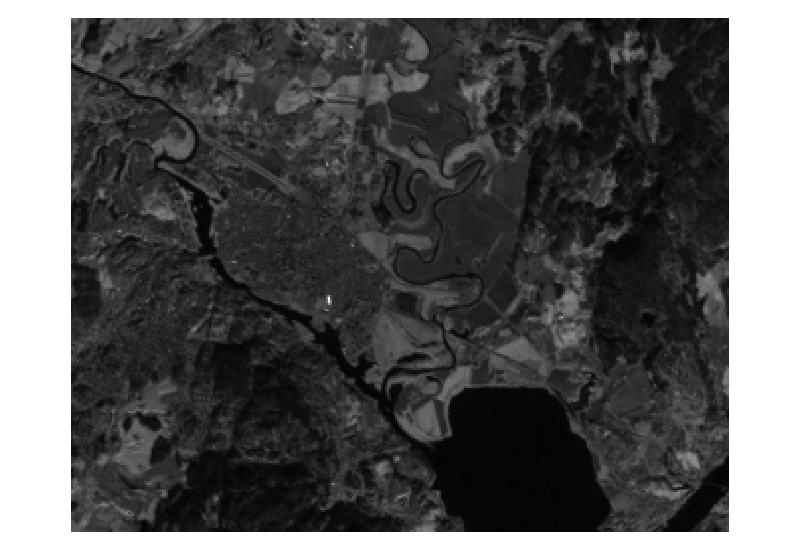
Figure 5.1 Original `tm5.png`.
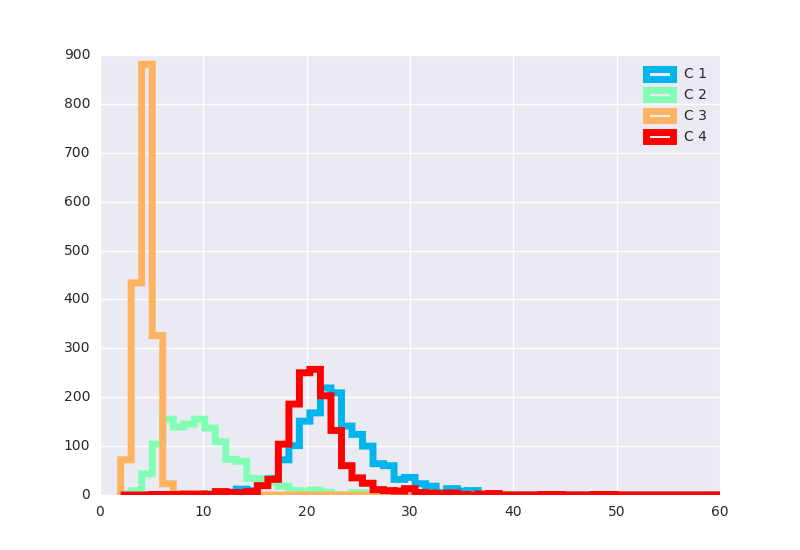
Figure 5.2 Feature value distribution from training, `tm5.png`.
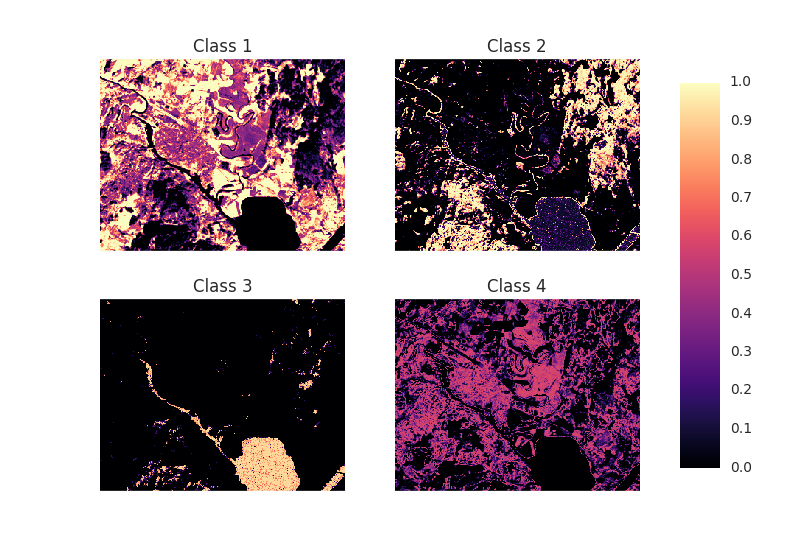
Figure 5.3 Posterior images from `tm5.png`.
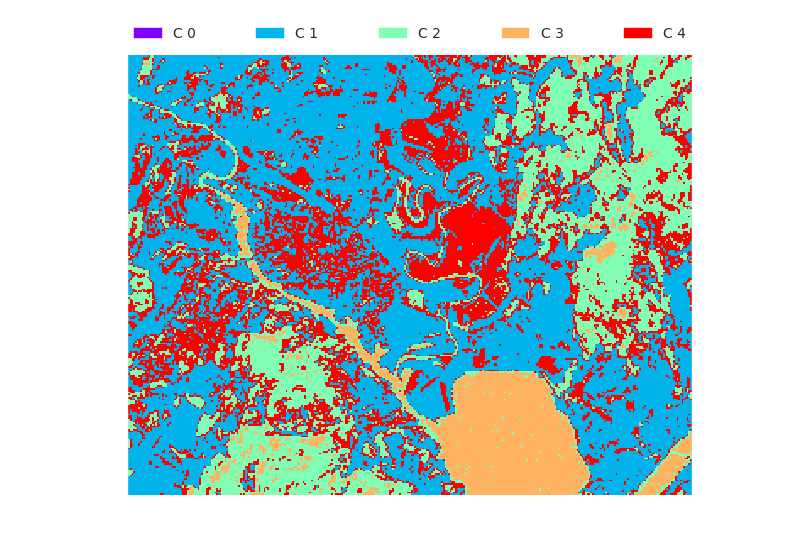
Figure 5.4 Classification result on `tm5.png`.
| Measure | Class 1 | Class 2 | Class 3 | Class 4 |
|---|---|---|---|---|
| RP | 1,729 | 2,824 | 1,979 | 1,605 |
| RN | 6,408 | 5,313 | 6,158 | 6,532 |
| PP | 1,330 | 1,996 | 2,072 | 2,739 |
| PN | 6,807 | 6,141 | 6,065 | 5,398 |
| TP | 814 | 1,875 | 1,913 | 1,133 |
| FP | 516 | 121 | 159 | 1,606 |
| FN | 915 | 949 | 66 | 472 |
| TN | 5,892 | 5,192 | 5,999 | 4,926 |
| tpr | 0.47 | 0.66 | 0.97 | 0.71 |
| tnr | 0.92 | 0.98 | 0.97 | 0.75 |
| ppv | 0.61 | 0.94 | 0.92 | 0.41 |
| npv | 0.87 | 0.85 | 0.99 | 0.91 |
| acc | 0.82 | 0.87 | 0.97 | 0.74 |
| iou | 0.36 | 0.64 | 0.89 | 0.35 |
| dsc | 0.53 | 0.78 | 0.94 | 0.52 |
| auc | 0.70 | 0.82 | 0.97 | 0.73 |
Feature image 6
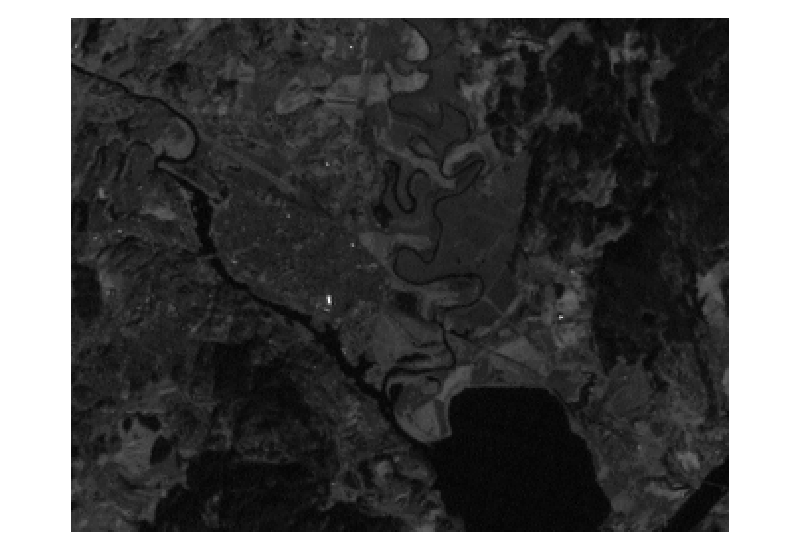
Figure 6.1 Original `tm1.png`.
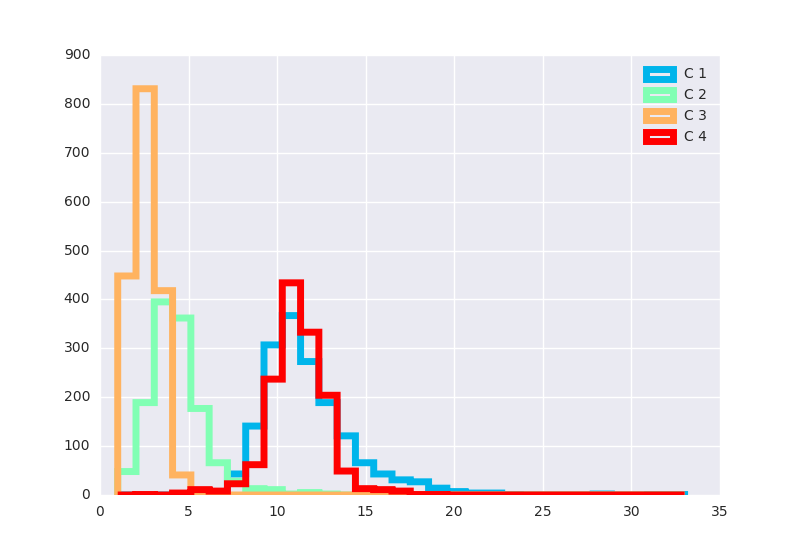
Figure 6.2 Feature value distribution from training, `tm6.png`.
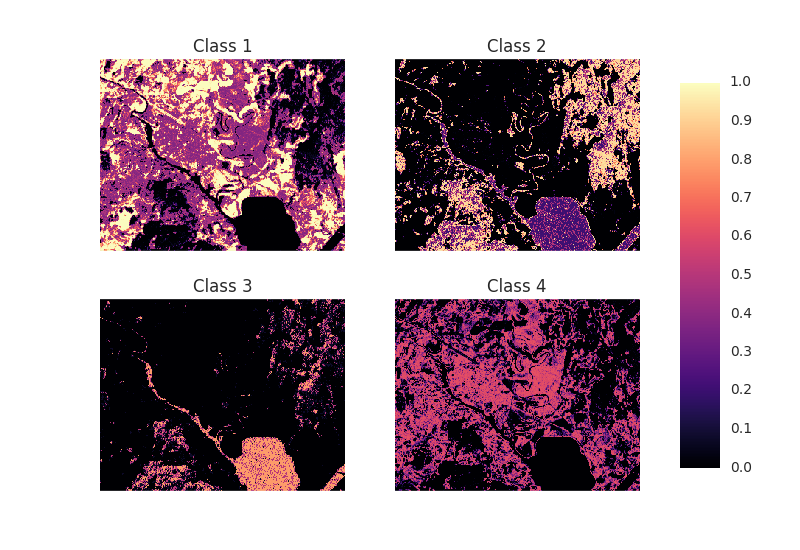
Figure 6.3 Posterior images from `tm6.png`.
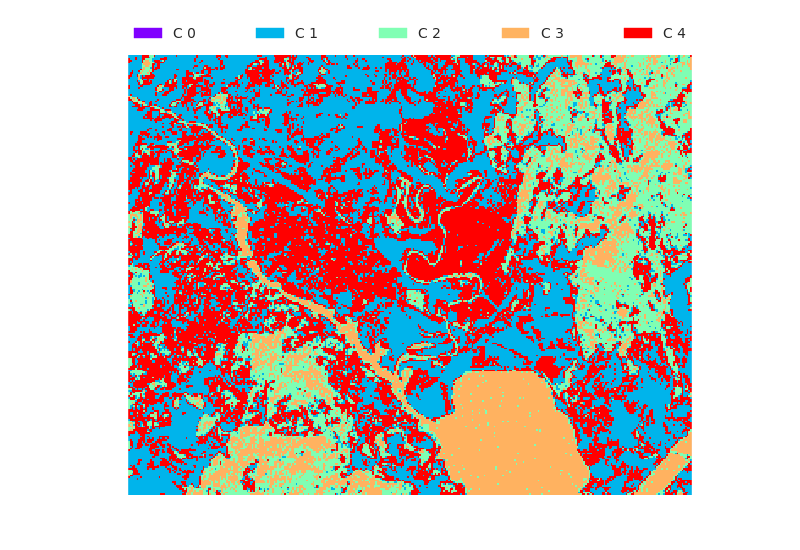
Figure 6.4 Classification result on `tm6.png`.
| Measure | Class 1 | Class 2 | Class 3 | Class 4 |
|---|---|---|---|---|
| RP | 1,729 | 2,824 | 1,979 | 1,605 |
| RN | 6,408 | 5,313 | 6,158 | 6,532 |
| PP | 938 | 1,913 | 2,481 | 2,805 |
| PN | 7,199 | 6,224 | 5,656 | 5,332 |
| TP | 442 | 1,833 | 1,915 | 1,307 |
| FP | 496 | 80 | 566 | 1,498 |
| FN | 1,287 | 991 | 64 | 298 |
| TN | 5,912 | 5,233 | 5,592 | 5,034 |
| tpr | 0.26 | 0.65 | 0.97 | 0.81 |
| tnr | 0.92 | 0.98 | 0.91 | 0.77 |
| ppv | 0.47 | 0.96 | 0.77 | 0.47 |
| npv | 0.82 | 0.84 | 0.99 | 0.94 |
| acc | 0.78 | 0.87 | 0.92 | 0.78 |
| iou | 0.20 | 0.63 | 0.75 | 0.42 |
| dsc | 0.33 | 0.77 | 0.86 | 0.59 |
| auc | 0.59 | 0.82 | 0.94 | 0.79 |